Reporting
HomePort reports
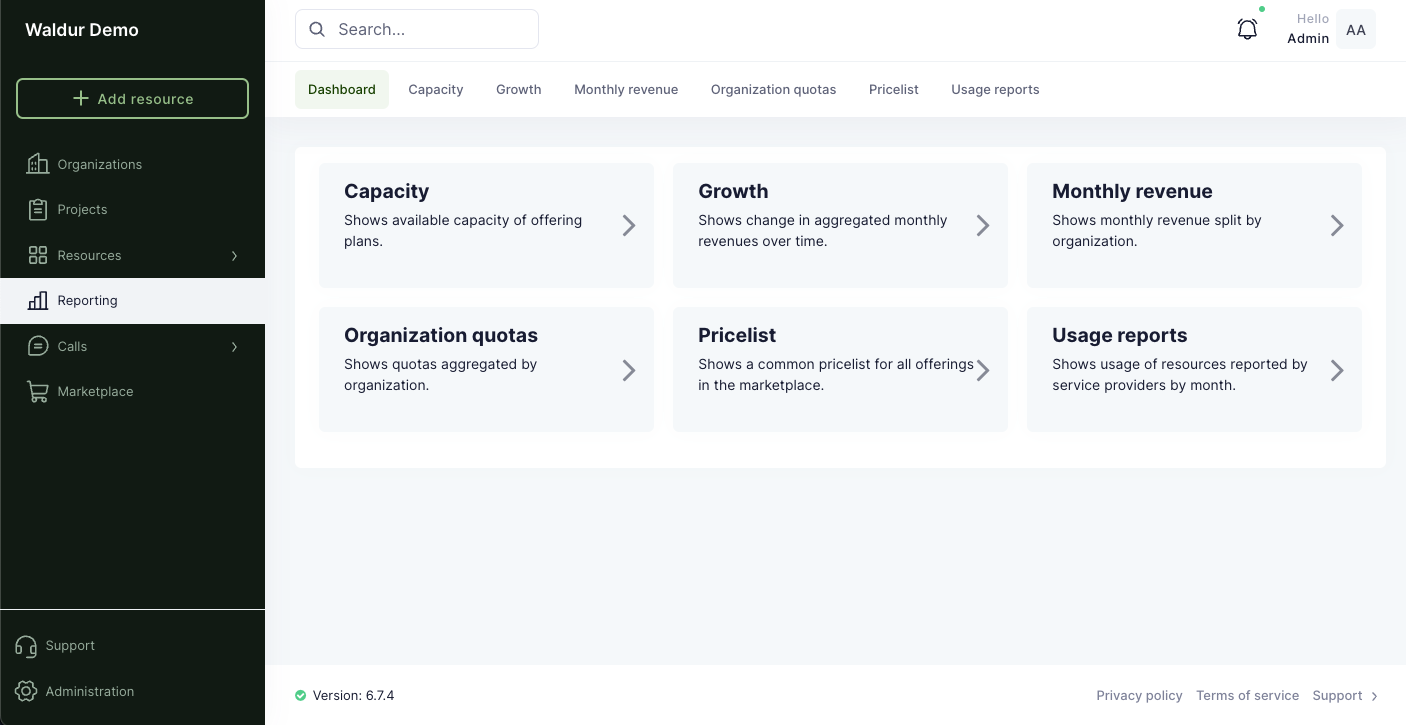
Waldur HomePort includes a number of built-in reports based on the user activity. Reports can be accessed by staff and support users from the "Reporting" sidebar menu.
Reports for organization owners
An administrator can enable the customer.show_organisation_reporting feature flag, which gives
organization owners their own Reporting menu scoped to the organizations they own. The menu lists
only the reports that make sense for a single organization:
- Organization summary — the organization's resources by project, with limits and usage.
- Quotas — resource count, estimated cost and cloud quota usage.
- Usage — component-level usage per resource over a period.
- Usage by user — component usage attributed to individual team members.
- Project detail — resource limit and usage history of one project.
An owner picks the organization to report on from a selector on the reporting pages. Organization managers are not included: only owners see the menu. Staff and support users keep the full report list, and the flag does not change what they see.
Grafana and Prometheus Metrics
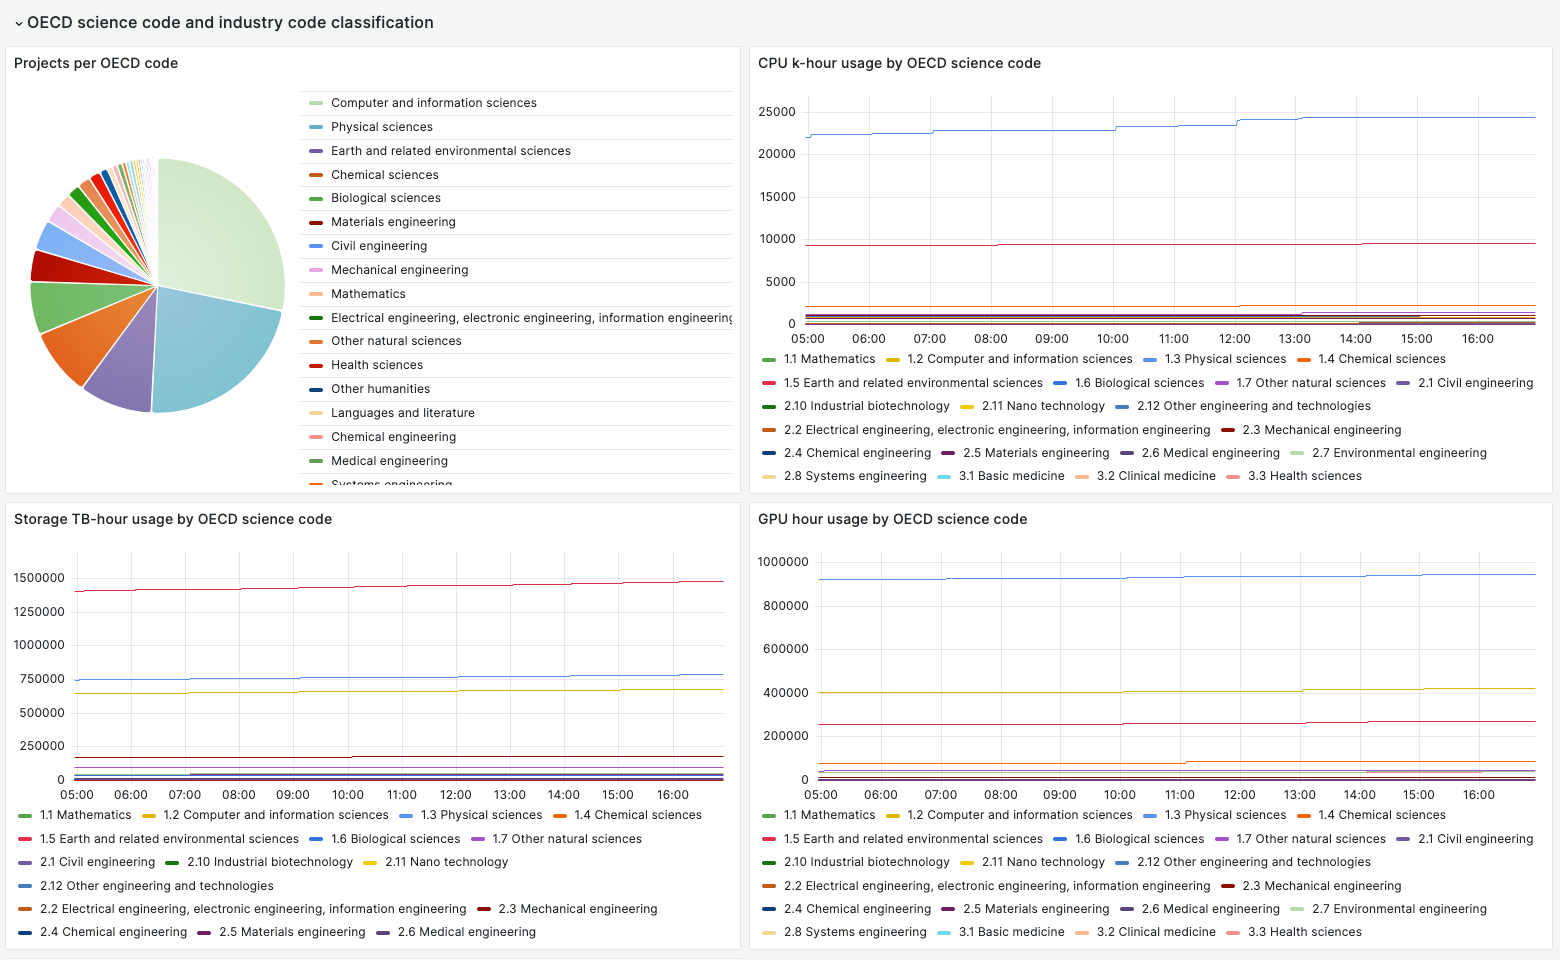
Waldur supports exporters to Prometheus of different statistical metrics that can be used for building business dashboards, for example, in Grafana.
Check out details about the setup of the exporter.
Custom reports
It is possible to implement custom metric collection and report generation using Waldur SDK. Several examples are provided in the section for integrators.