Credit consumption dashboard
A project funded by a credit shows a Credit consumption block on its dashboard. It answers three questions: how this month is going, how much of the allocation is left, and what is going to happen.
Note
The block appears only for projects that have a credit allocation. A project without one shows nothing — there is no credit to report on. See Credit management for how allocations are made.
This month's credit consumption
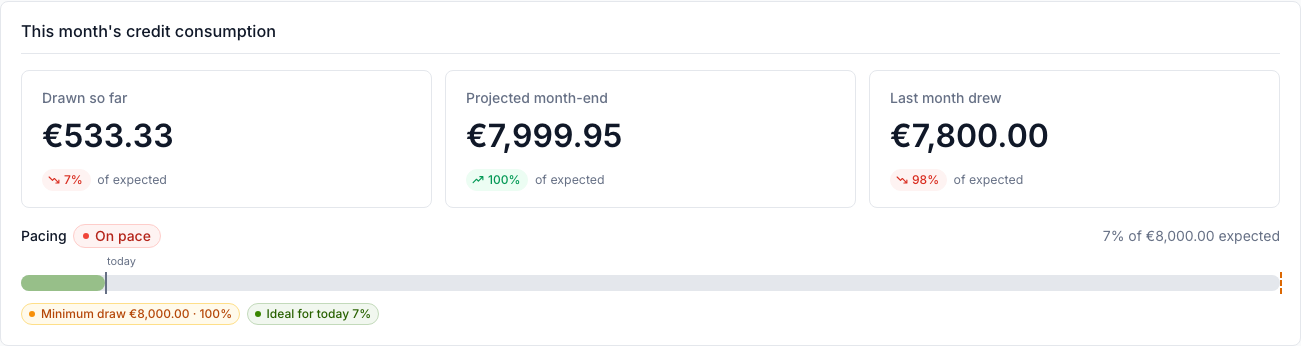
| Figure | Meaning |
|---|---|
| Drawn so far | Cost booked this month that this credit will be drawn against. Not yet a draw: compensation is written when the month closes. |
| Projected month-end | That figure extended to the end of the month at the current rate. Early in the month it moves a lot, because it is dividing by very few days. |
| Last month drew | What the credit actually paid out last month, from the closed invoice. |
Each is shown as a percentage of expected consumption — the monthly figure the credit was set up with, not the balance.
The Pacing bar underneath compares where consumption stands against where a linear ramp says it should stand today. Ahead of pace means the credit is being used faster than the ramp, behind pace slower.
Warning
The minimum draw is taken whether or not it is used. If a project consumes less than the minimum in a month, the shortfall still comes off the balance — it is simply not spent on anything. That is why a project can be "behind pace" and still lose credit.
Overall credit
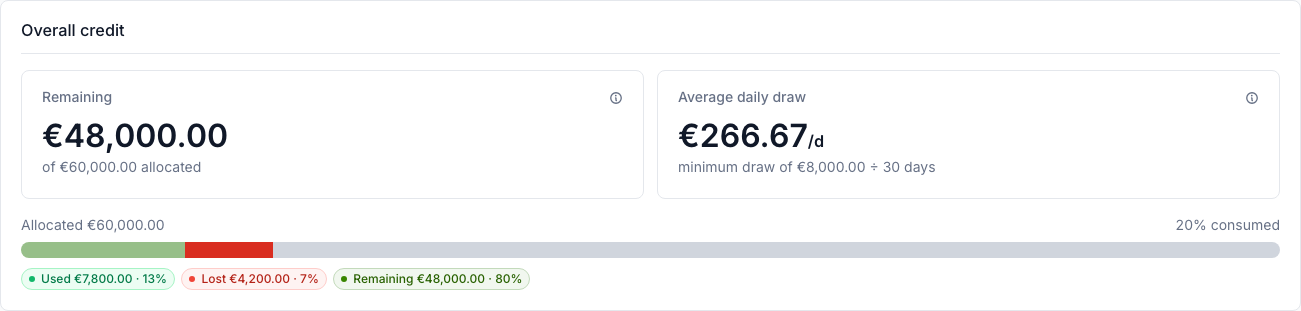
Remaining is the balance against the total allocated. Average daily draw is the rate the projections below are built from, and the caption states where it comes from — usually the minimum draw divided over a nominal 30-day month.
The bar splits the allocation three ways, and the distinction matters:
- Used — credit drawn against real consumption. It bought something.
- Lost — credit taken by the minimum draw, or written off at expiry, with no consumption behind it. It bought nothing.
- Remaining — still available.
A large Lost share means the credit's expected consumption is set higher than the project actually uses.
What happens next

Everything with an end date, soonest first. Each row states what it does, because the consequences differ sharply:
| Row | What it does |
|---|---|
| Credit balance is empty | Compensation stops and costs start landing on the invoice. Resources are unaffected. |
| Credit expires | Compensation stops on the expiry date. Anything left is written off at the month-end run a month later — the balance visible in between is a residue, not something to spend. |
| Project reaches its end date | Resources are paused for the grace period; offerings that opt out of the grace period are terminated immediately. |
| Grace period ends | Every remaining resource is terminated. |
| Last resource ends | Nothing is left running, so the credit stops being drawn — but the minimum monthly draw still applies to whatever is left. |
| A cost policy | Either an estimate of when the policy will fire, or — dated today — a threshold that has already been reached. |
Note
A row marked policy is an estimate, and says so. A cost policy dated today is not an estimate: the threshold has been reached and the policy is triggered. Note that a cost policy does not fire on cost alone — the credit balance must also have fallen to the policy's limit — so a project can be over its cap and still not be firing.
Where a policy that pauses or terminates resources has reached its threshold, the credit rows say so rather than claiming resources keep running.
Charts
Additional charts — a credit burn-down with a projected exhaustion date, usage treemaps, per-offering
bars — are turned off by default. An administrator enables them per deployment; see
Feature flags for the dashboard.*
options.