Project metrics
Some services report metrics about what they do for your project — how many learners completed a course, how many tickets were resolved, how fast support answered. When a resource in your project comes from such a service, the project gets a Metrics tab.
The Metrics tab
Open the project and select Metrics. The tab appears when one of the project's resources comes from a service that has adopted metrics — even before the service has reported anything.
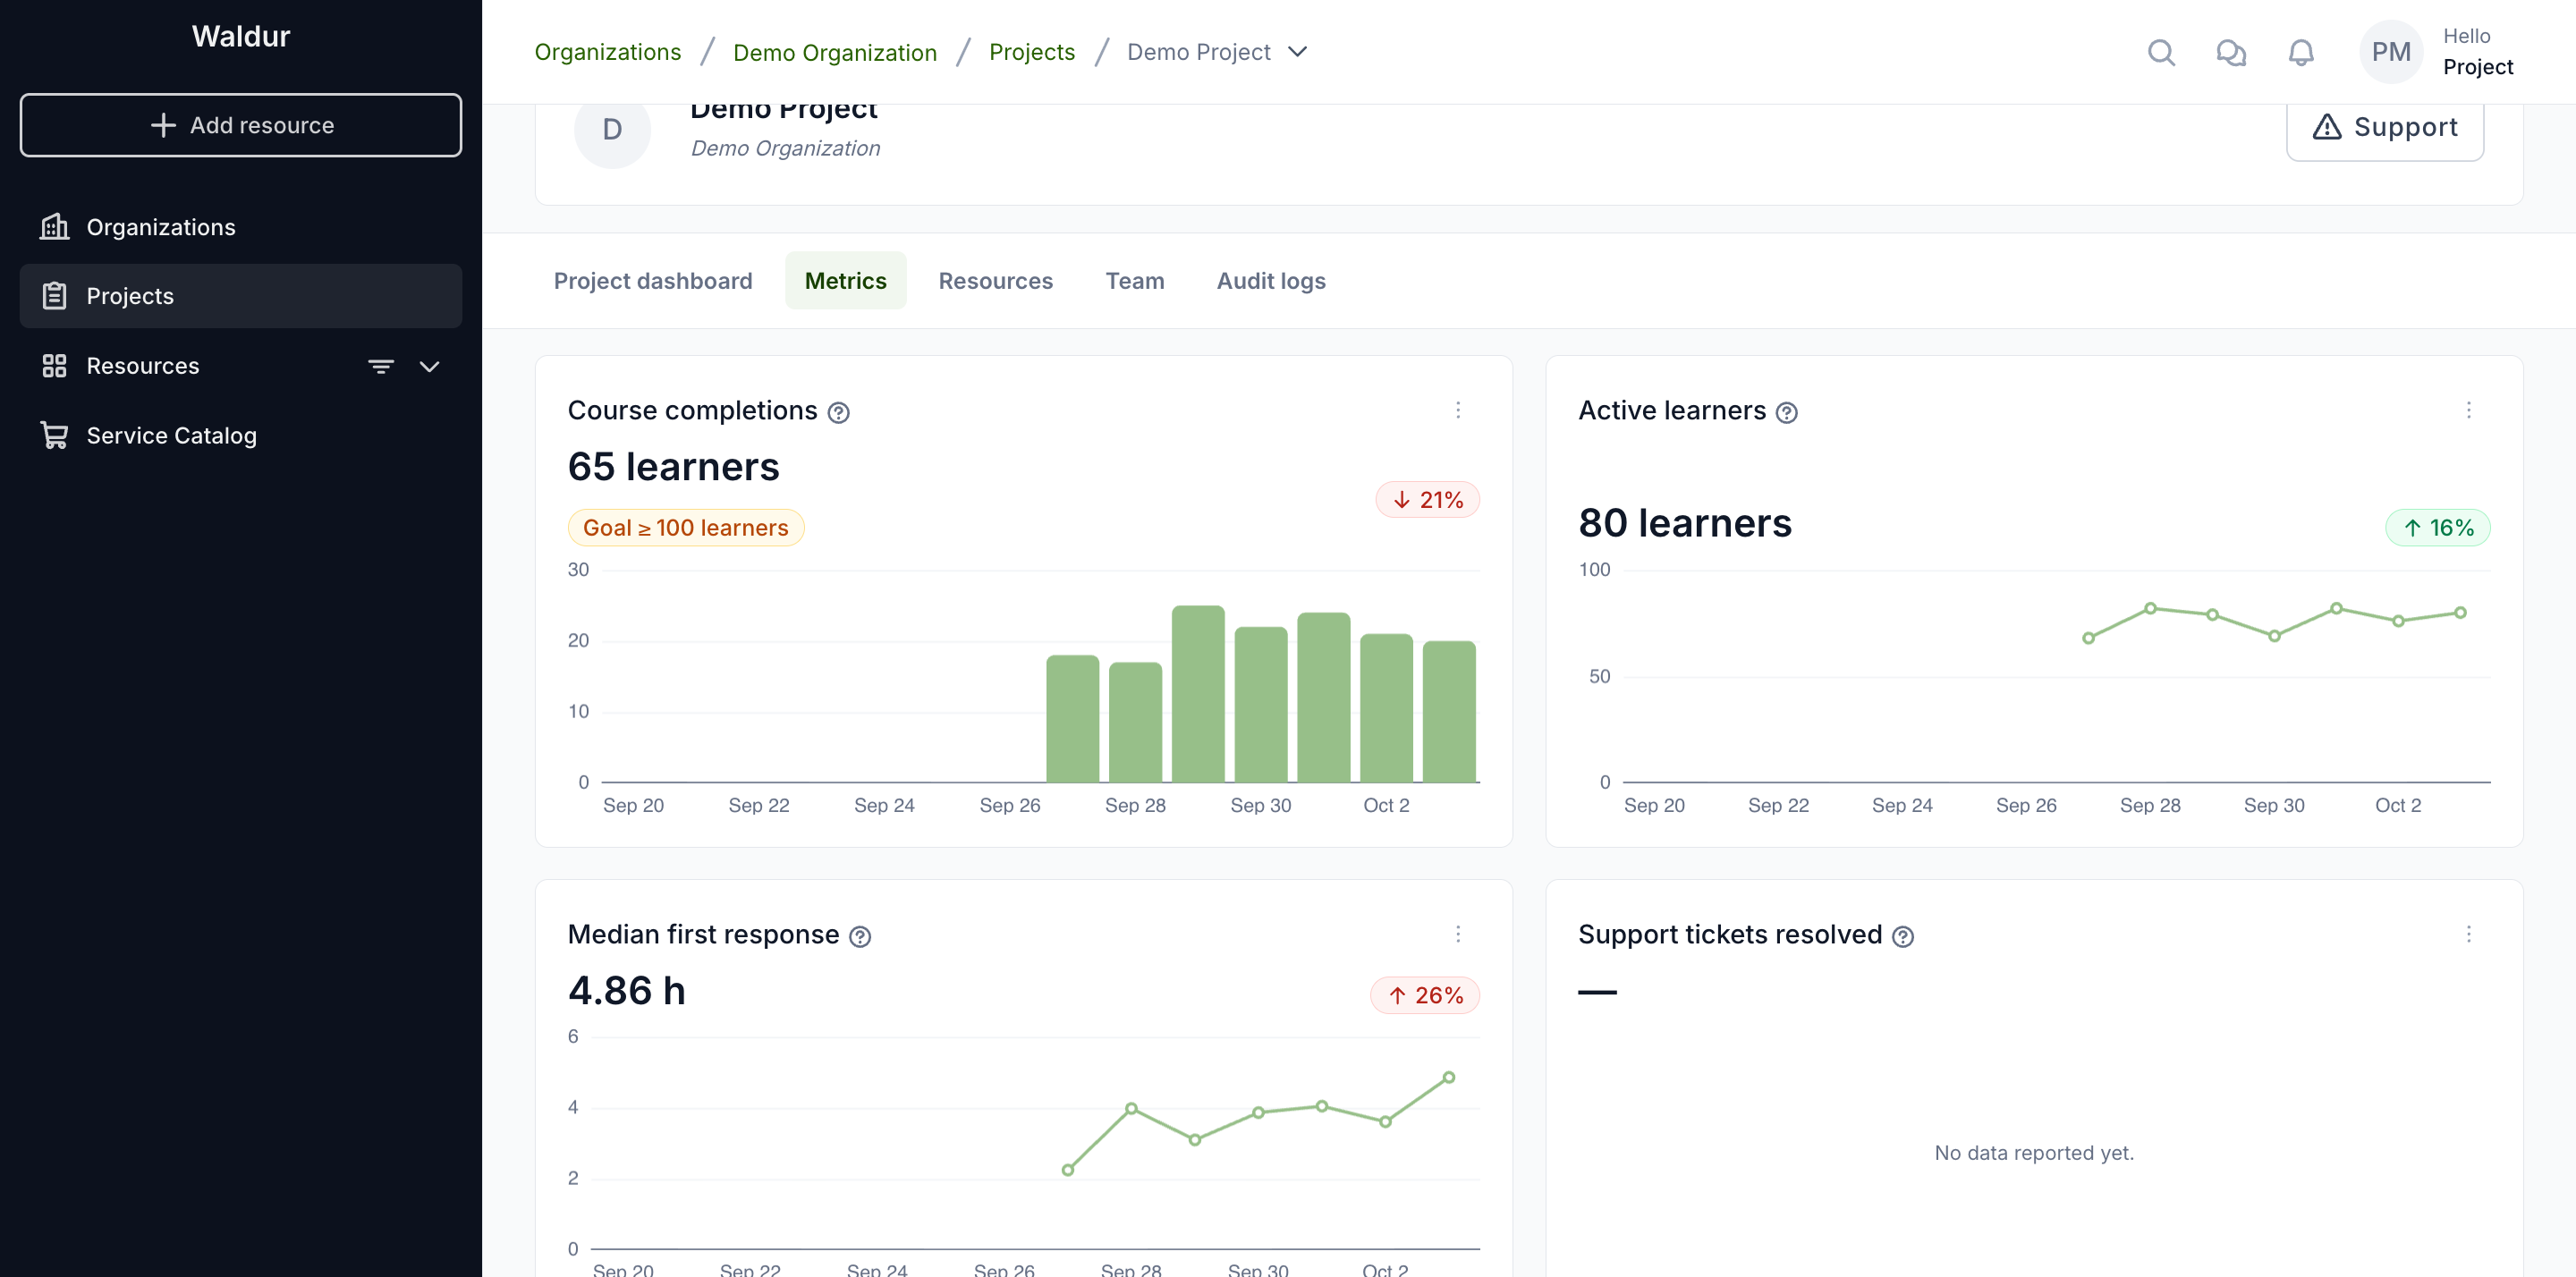
Each card is one metric:
- The figure — for a count (completions, tickets), the total for the current period; for a level (active learners, response time), the latest value. When several resources report the same metric, their figures are added up or averaged, as the service decided.
- The change — compared with the same stretch of the previous period: five days into October are measured against the first five days of September, not against all of it. A goal over the last 30 days is compared with the 30 days before. For a metric where higher is better a rise is green; where lower is better, such as a response time, a rise is red. Metrics with no preferred direction show a rise in green. The badge appears only when both periods have a figure.
- The goal, if one is set — green when the figure meets it.
- The chart — one point per day (in UTC), from the first day with data, up to 90 days back. Counts are bars; levels are a line, with the goal drawn across it. Days without data are left empty. When the metric carries attributes, the chart is split by the first one — per user, per software, per course — with the five largest values named and the rest shown as Other. A value keeps its colour on every card. Split chart by … in the card's menu picks another attribute, and Show total only returns to one series; the full list is in the breakdown.
The question mark next to a metric's name says which service reports it and how the figure is computed. A metric the service has adopted but not reported yet says No data reported yet.
Figures are recomputed every 15 minutes, so a fresh report can take that long to appear.
Resources report, the project sees the total
A service reports a metric for each of its resources: the course environment, the support desk, the cluster allocation. The project's card combines the resources of that service in the project into one figure, the way the service decided: added up (three course environments with 10, 15 and 12 active learners show 37) or averaged (two support desks with median response times of 4 and 6 hours show 5). Goals apply to that combined figure, so a project has one goal per metric, whatever number of resources it has.
Each card belongs to one service. If two services in the project report the same metric, the tab shows two cards, each with its own figure and goal.
Breaking a figure down
When a metric carries attributes, such as the course or the support queue, choose Breakdown by … in the card's menu.
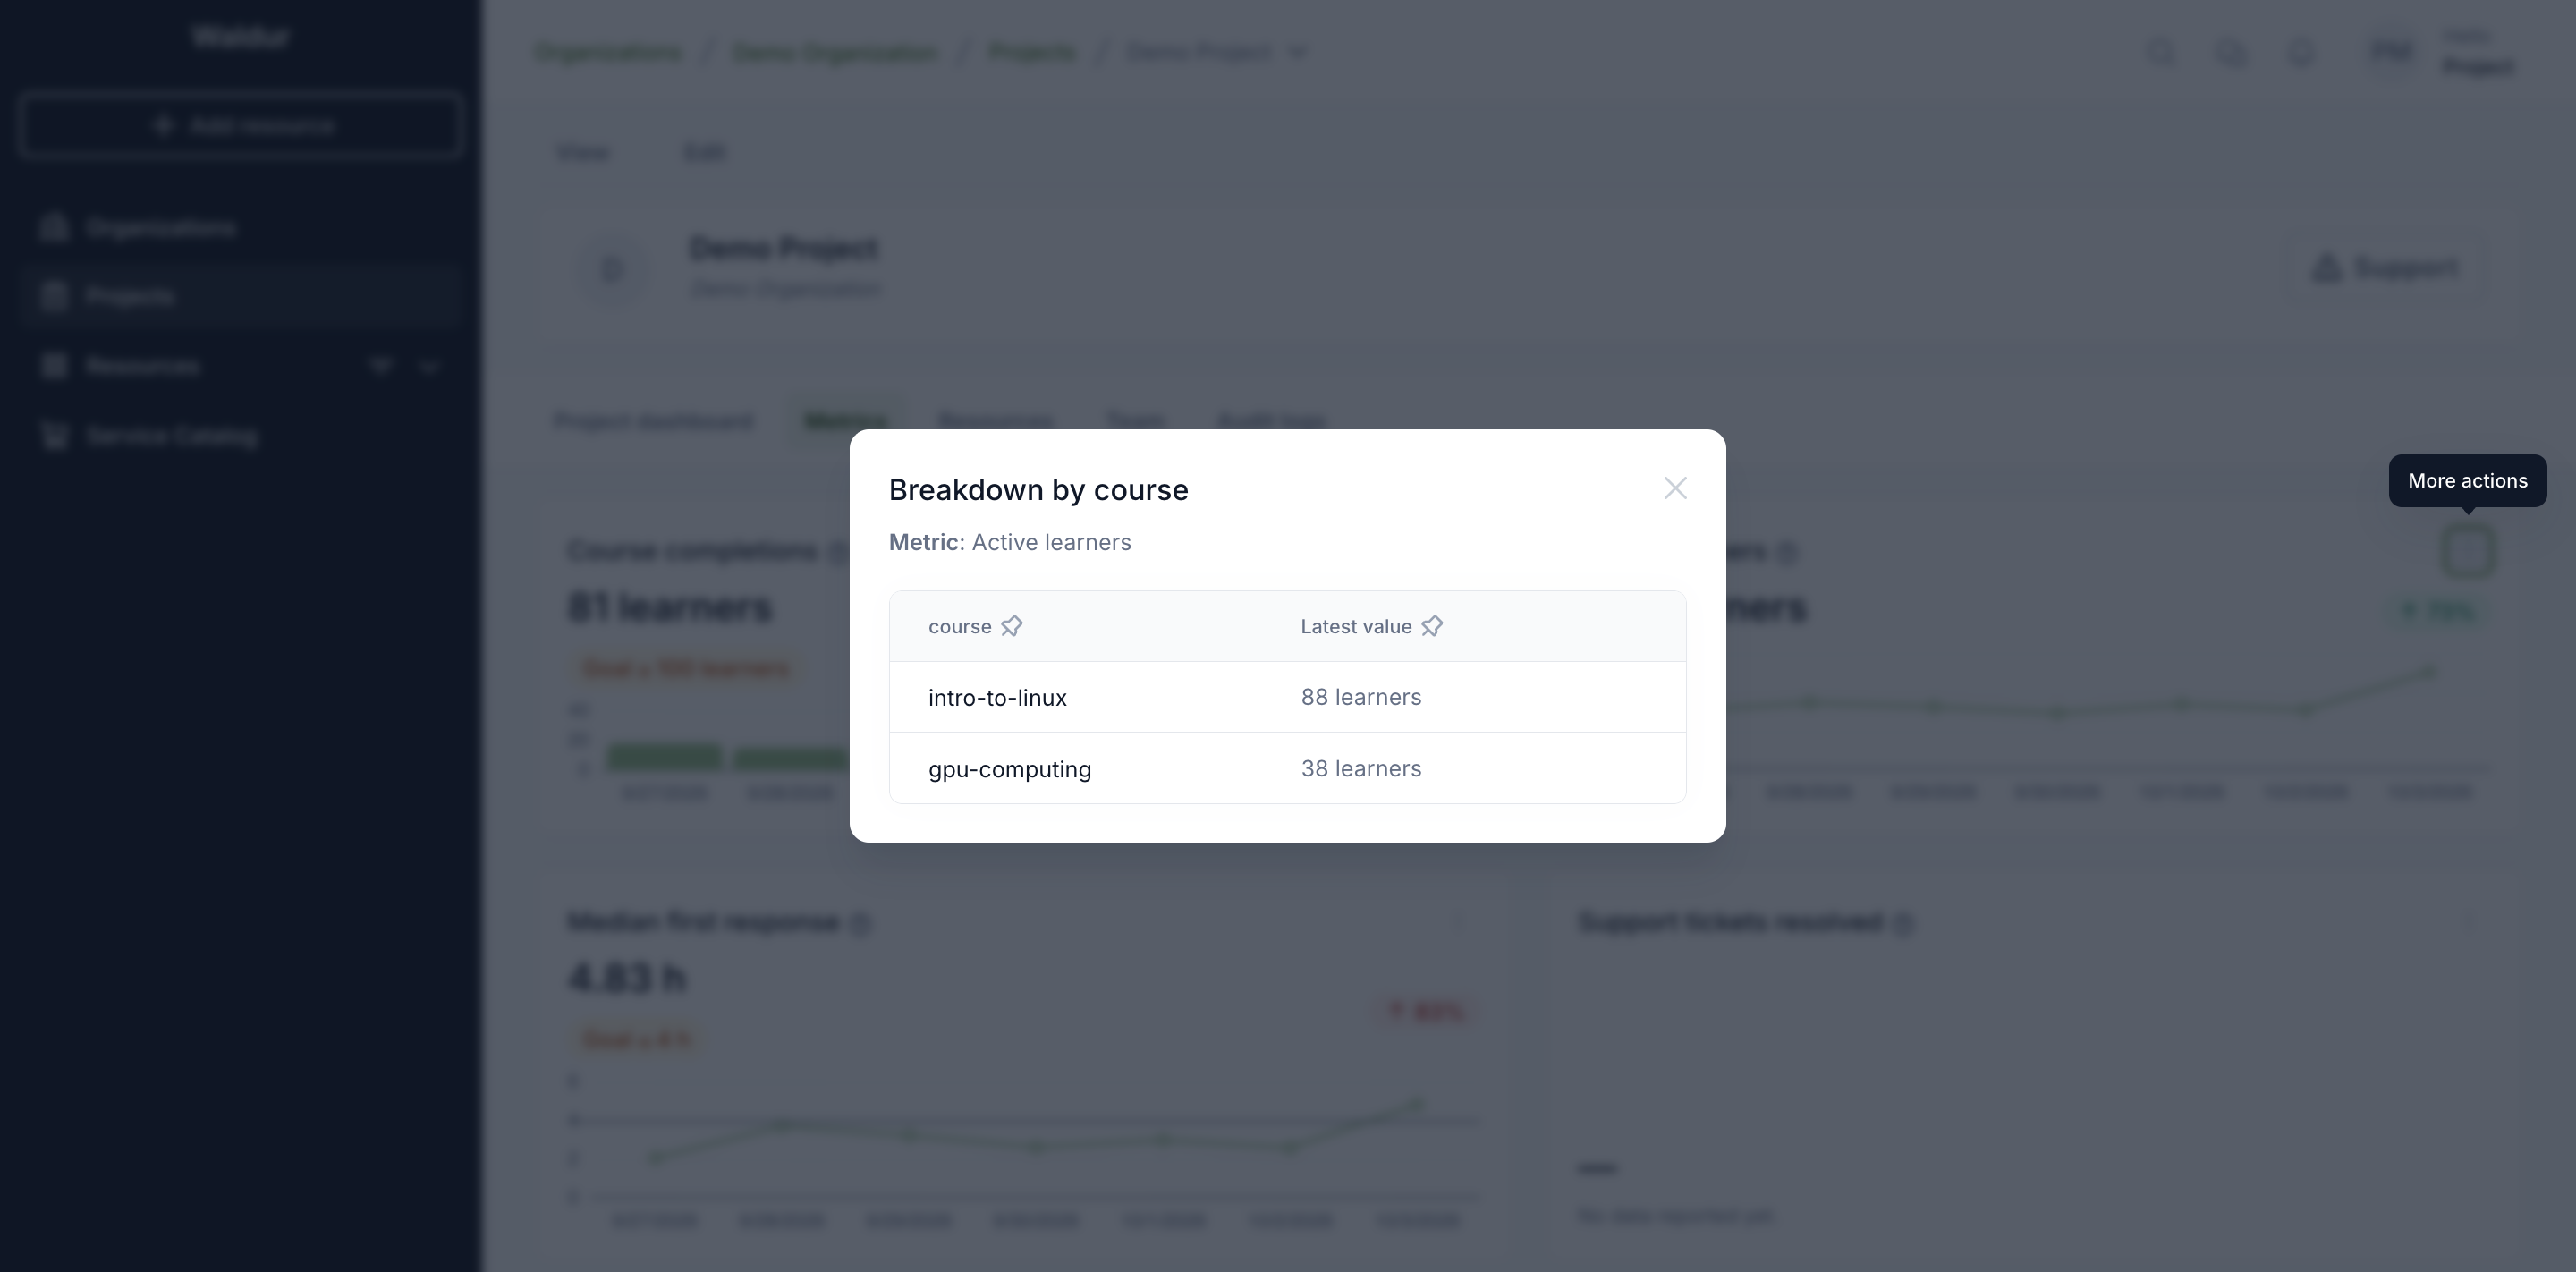
The dialog says which period it covers, the same as the card's: for a calendar month or quarter, from its first day up to now (for example October 2026, so far), so a breakdown early in a month is not a complete one.
Each value is computed the same way as the card. For metrics the service adds up across resources, the values add up to the card's figure; for metrics it averages, each value is the average of its own resources.
Looking at one resource
To see which resource drives a figure, choose Breakdown by resource in the card's menu. It lists the project's resources of that service with their figure for the card's period. For metrics the service adds up, the figures add up to the card's; for metrics it averages, each is that resource's own average.
Select a resource to open its Metrics tab. It shows the resource's own figures for the current month, the change from the same days of last month, the daily chart and the breakdown by attribute. A resource has no goal of its own: goals apply to the project's combined figure.
Setting the project's goal
Goals are set on the project's Metrics tab, where they apply to the project's combined figure. A resource's own Metrics tab has no goals.
The service may set a default goal for every project. Users who may edit the project, such as project managers and organization owners, can set the project's own goal instead: choose Set goal under the card's figure, or click the goal badge to change it. Set project goal (or Edit project goal) is also the first item of the card's menu.
Where are goals set?
- A project's goal — on the project's Metrics tab, from the card.
- The default goal for every project using a service — by the service provider, on the offering under Integration → Metrics, with Default goal in the metric's actions menu.
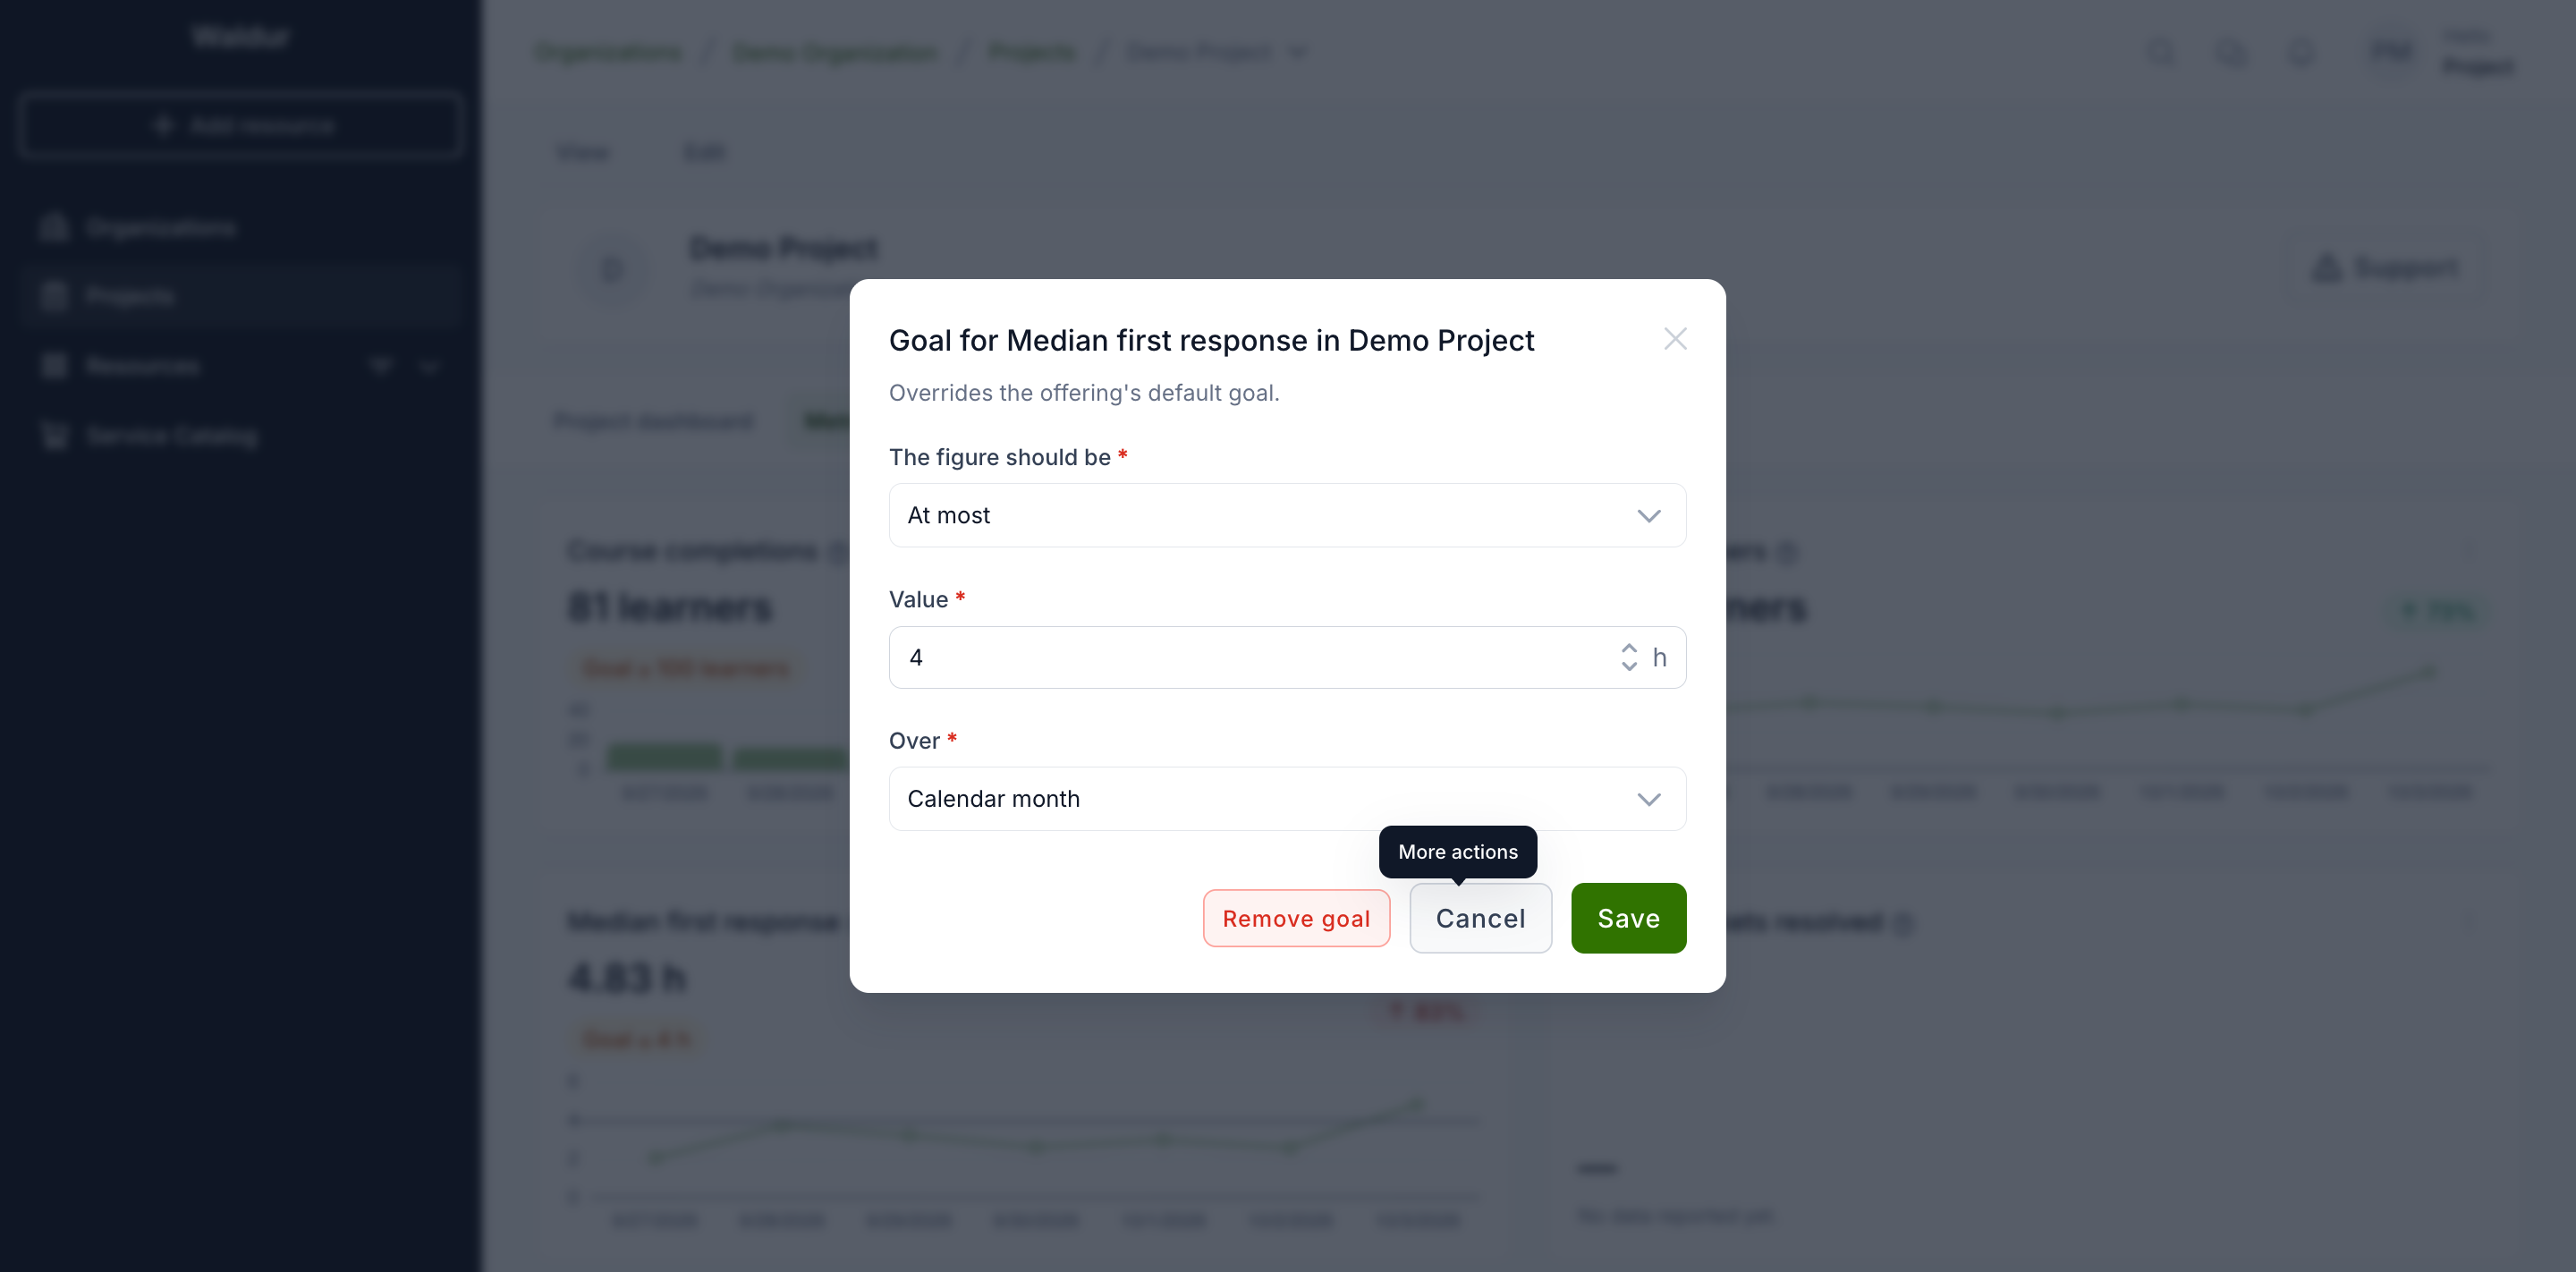
- The figure should be — At least for metrics where more is better, At most for metrics where less is better.
- Value — in the metric's unit.
- Over — a calendar month, a calendar quarter, or the last 30 days. The card's figure and change are computed over this period.
Remove goal asks for confirmation and goes back to the service's default goal, if there is one.